SAT-Race
2006
Result Analysis
On this page you can find a detailed comparison of the SAT-Race 2006 solvers.
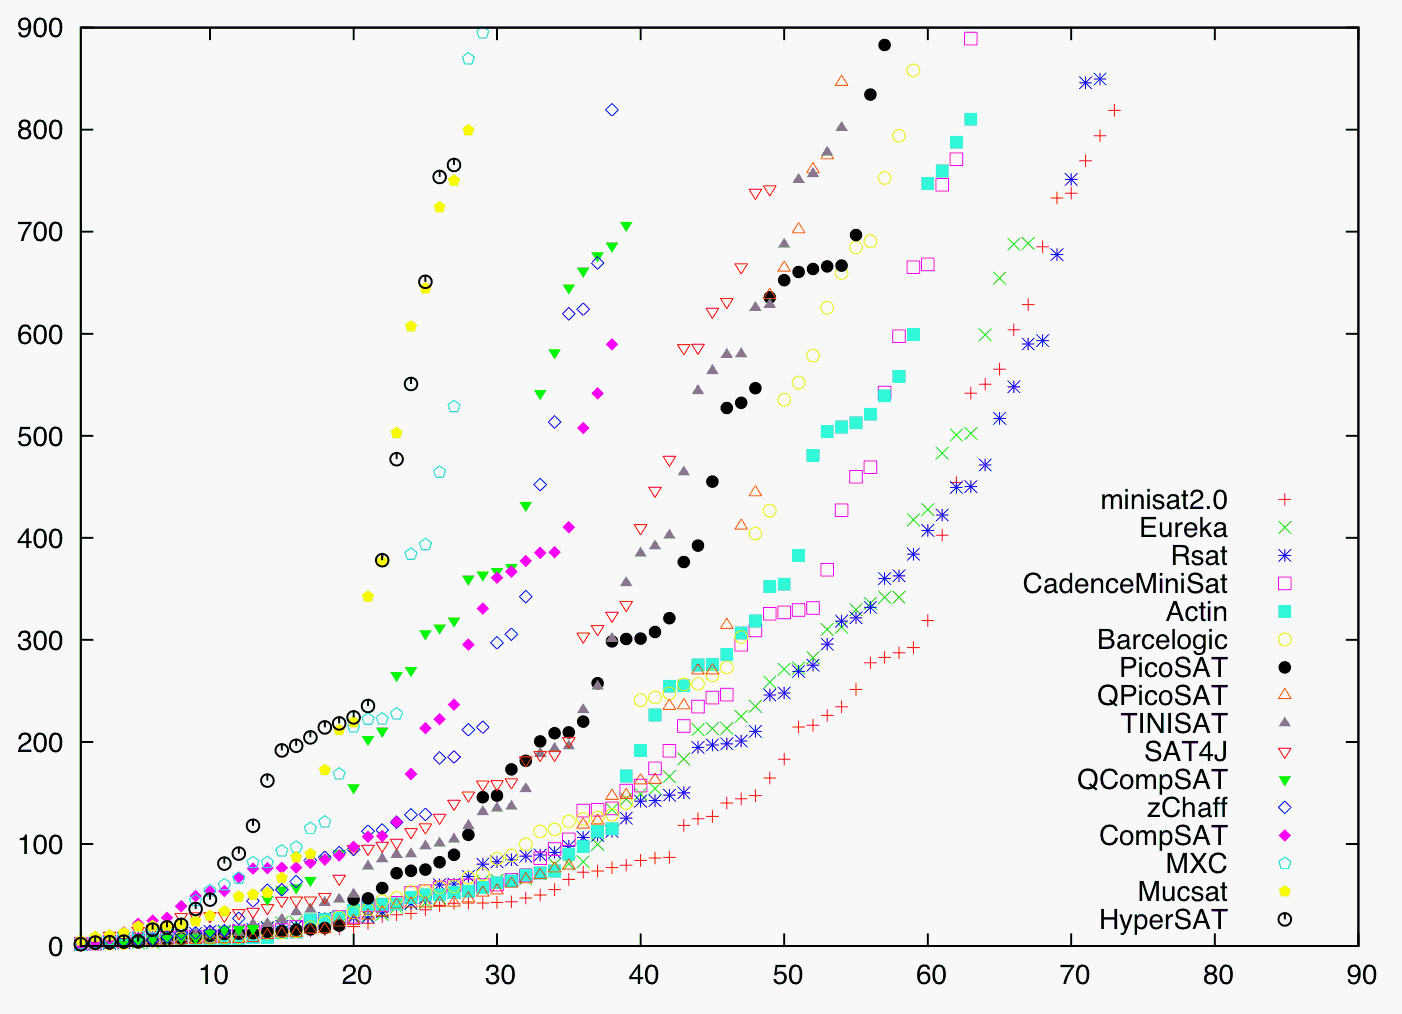
Runtime comparison of all SAT-Race solvers: threshold runtime (Tthr, in seconds) plotted against number of solved instances.
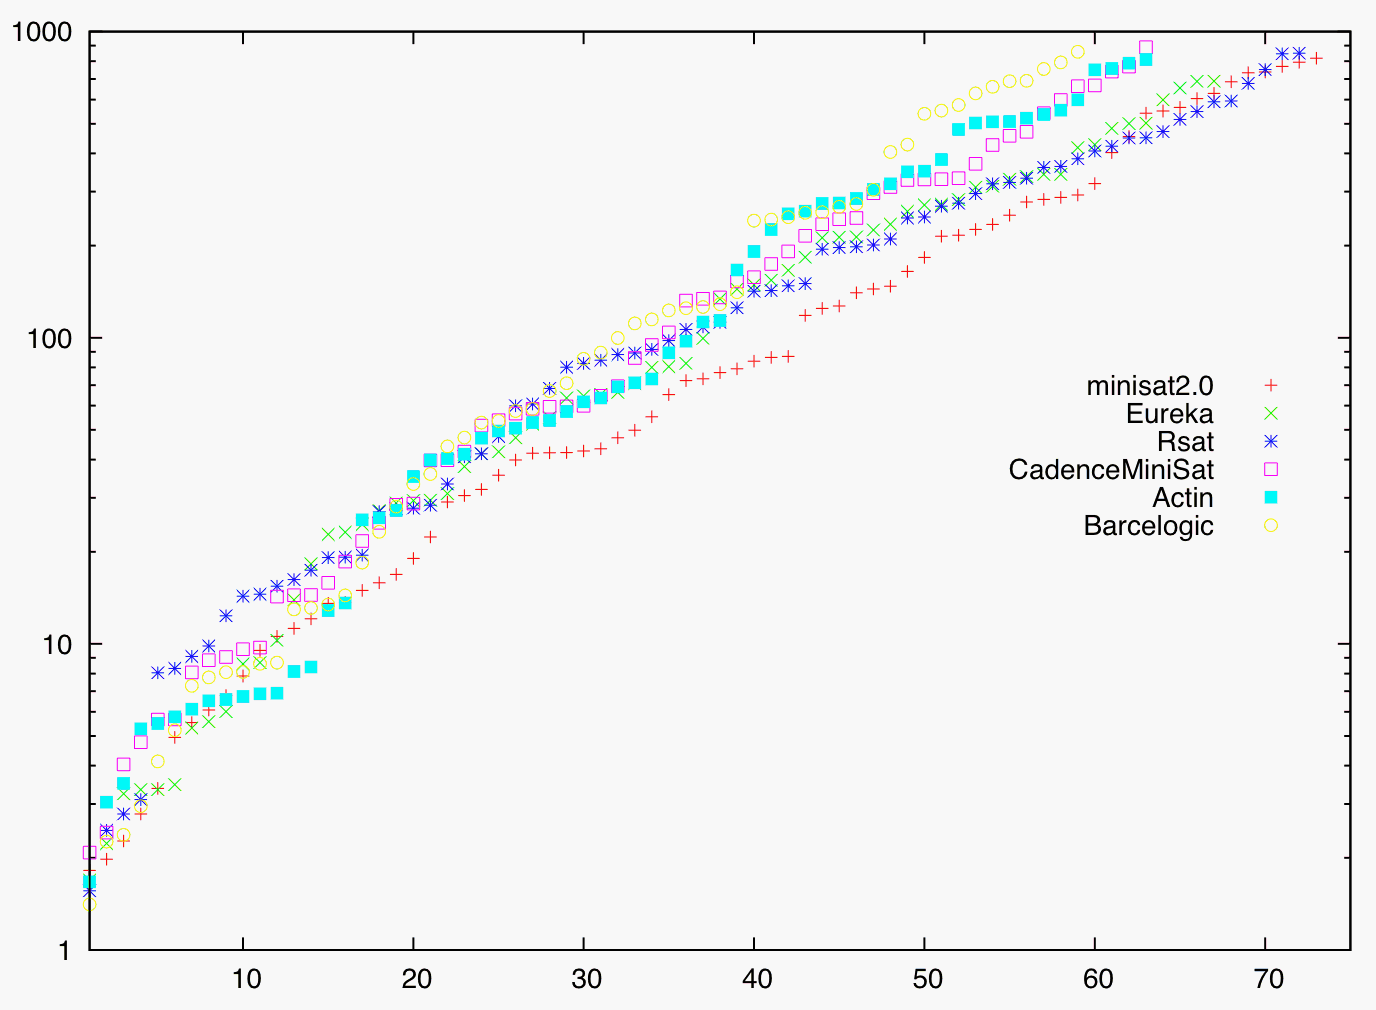
Runtime comparison of top-6 solvers: threshold runtime (on a logarithmic scale) plotted against number of solved instances. The three best solvers (minisat2.0, Eureka, Rsat) reveal a superior behavior at Tthr = 900.
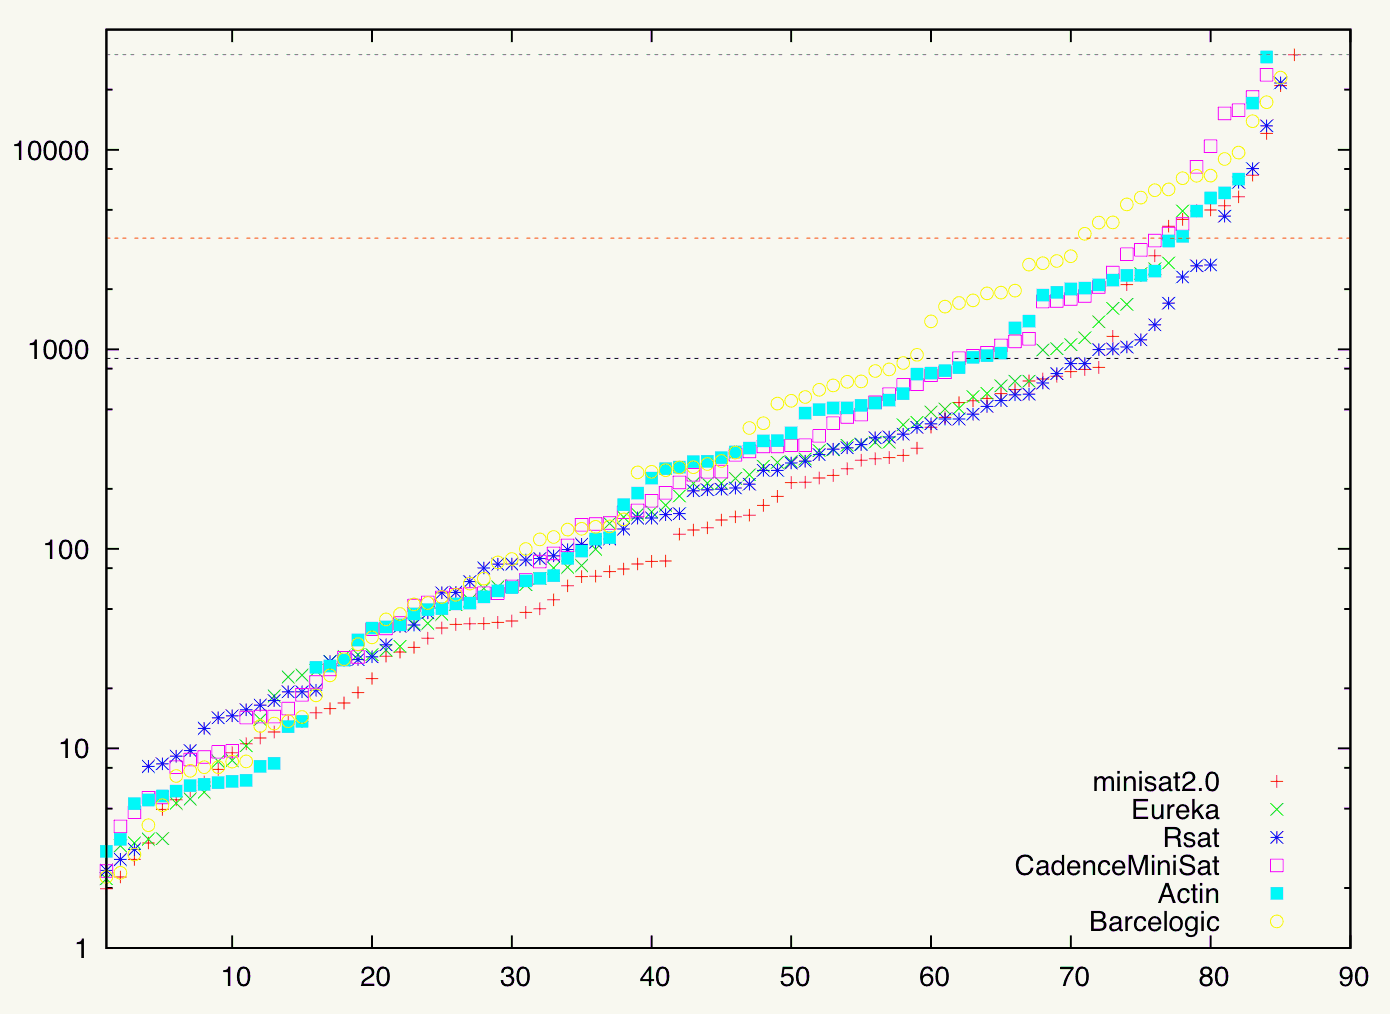
Runtime comparison of top-6 solvers at increased runtime thresholds (up to Tthr = 30,000 seconds): threshold runtime (on a logarithmic scale) plotted against number of solved instances. Behavior of solvers becomes less differentiable.
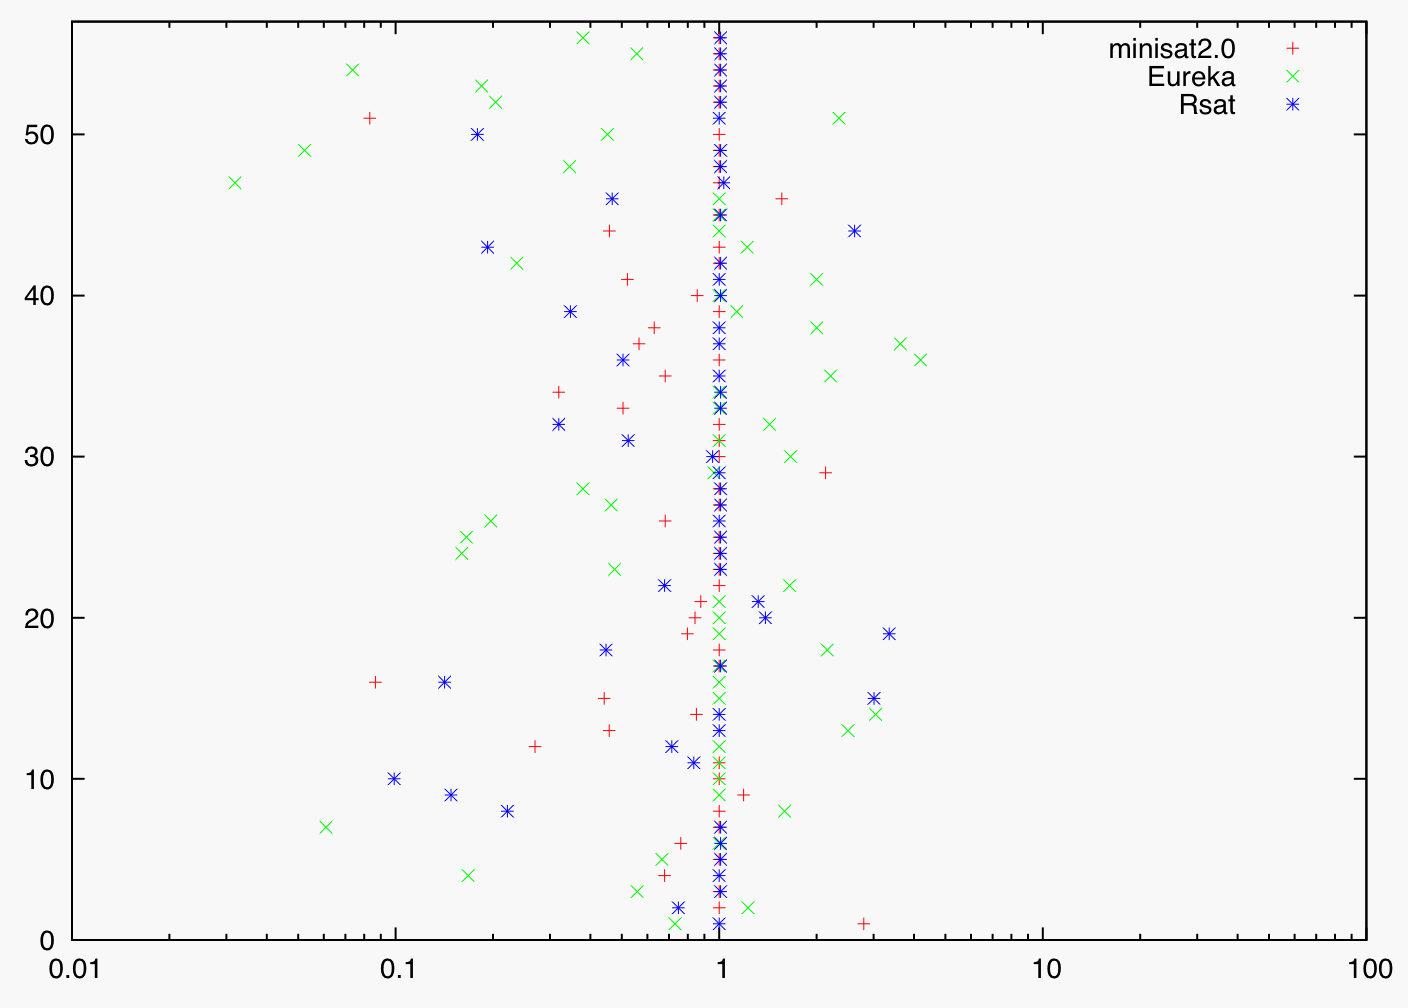
Robustness analysis of top-3 solvers: runtime factor compared to median runtime of top-3 solvers at Tthr = 900. On the x-axis the runtime factor (t / tmedian) is shown, on the y-axis the instance number. Data points to the left of the line x = 1 indicate better solver performance, data points right of the line worse solver performance (timeouts are considered as being solved in 900 seconds).
Scatter plots comparing the top-3 solvers: minisat2.0 vs. Eureka (left), minisat2.0 vs. Rsat (middle), Eureka vs. Rsat (right). Data points are shown as crosses; runtimes on logarithmic scales; auxiliary lines indicate runtime factors of 0.01, 0.1, 0.5, 1 (diagonal), 2, 10, and 100; regression line of data set (computed on linear scale) determined by least-squares method and shown as bold black solid line; crosses above the diagonal indicate better performance of the x-axis solver, crosses below the diagonal better performance of the y-axis solver.
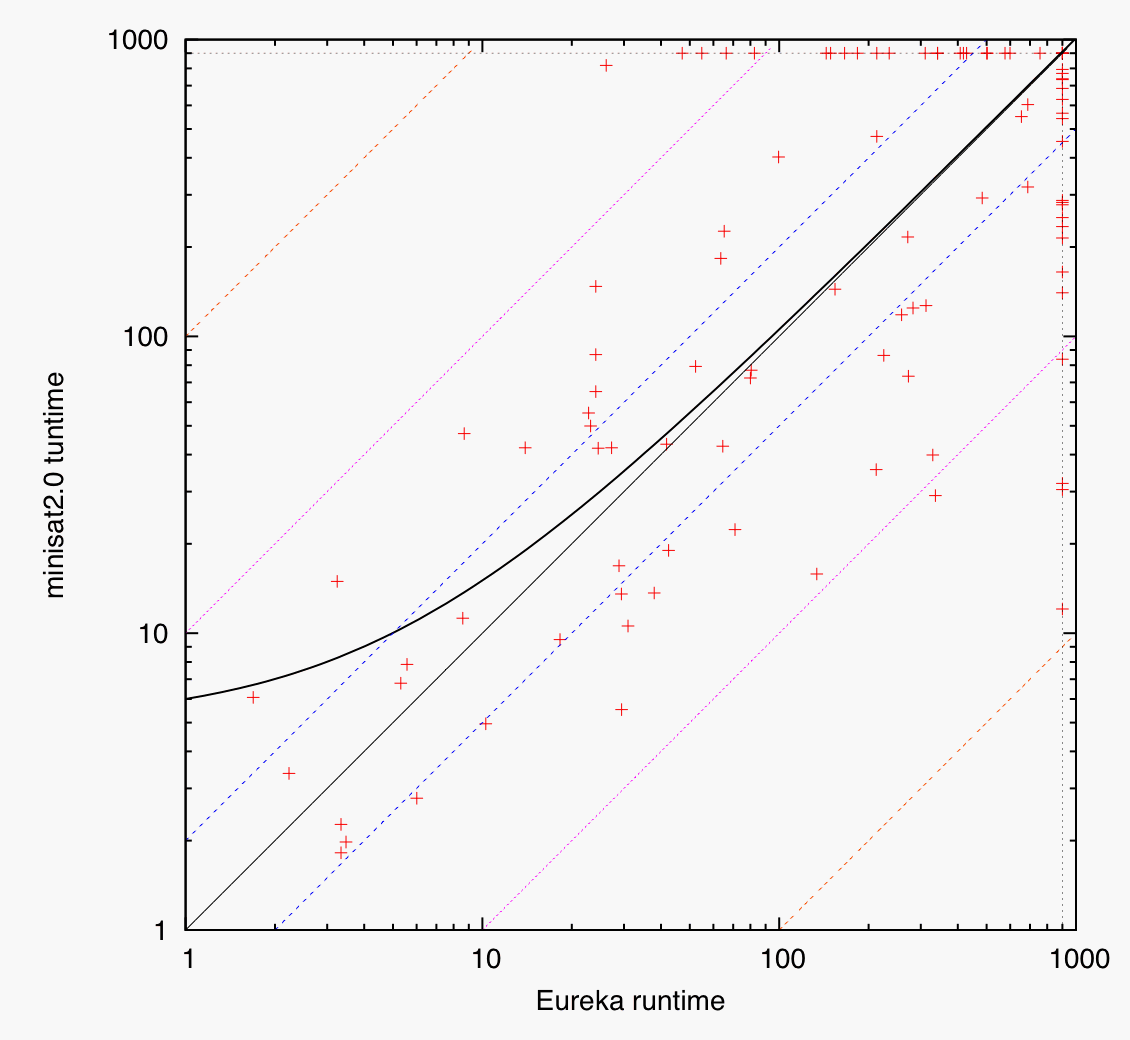
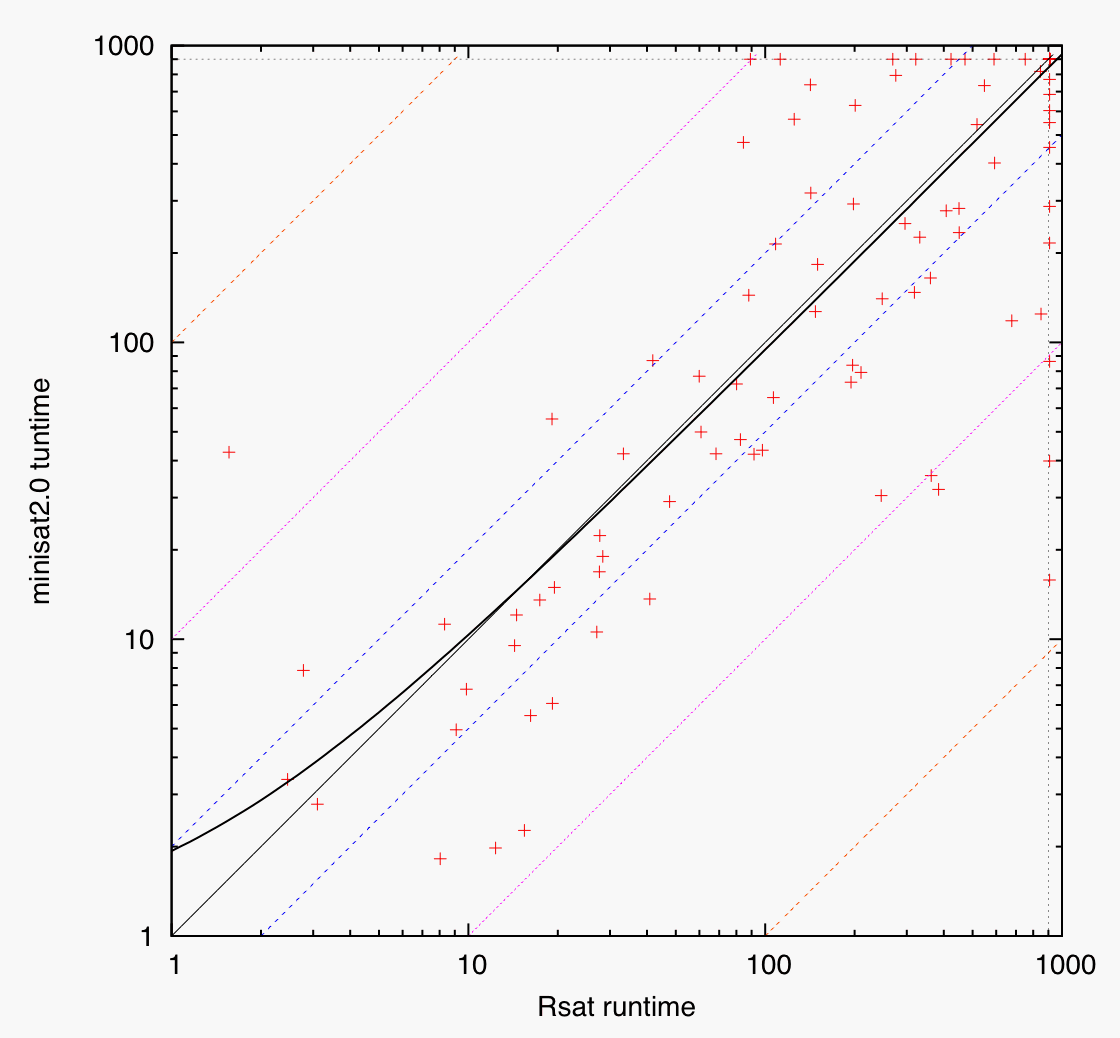
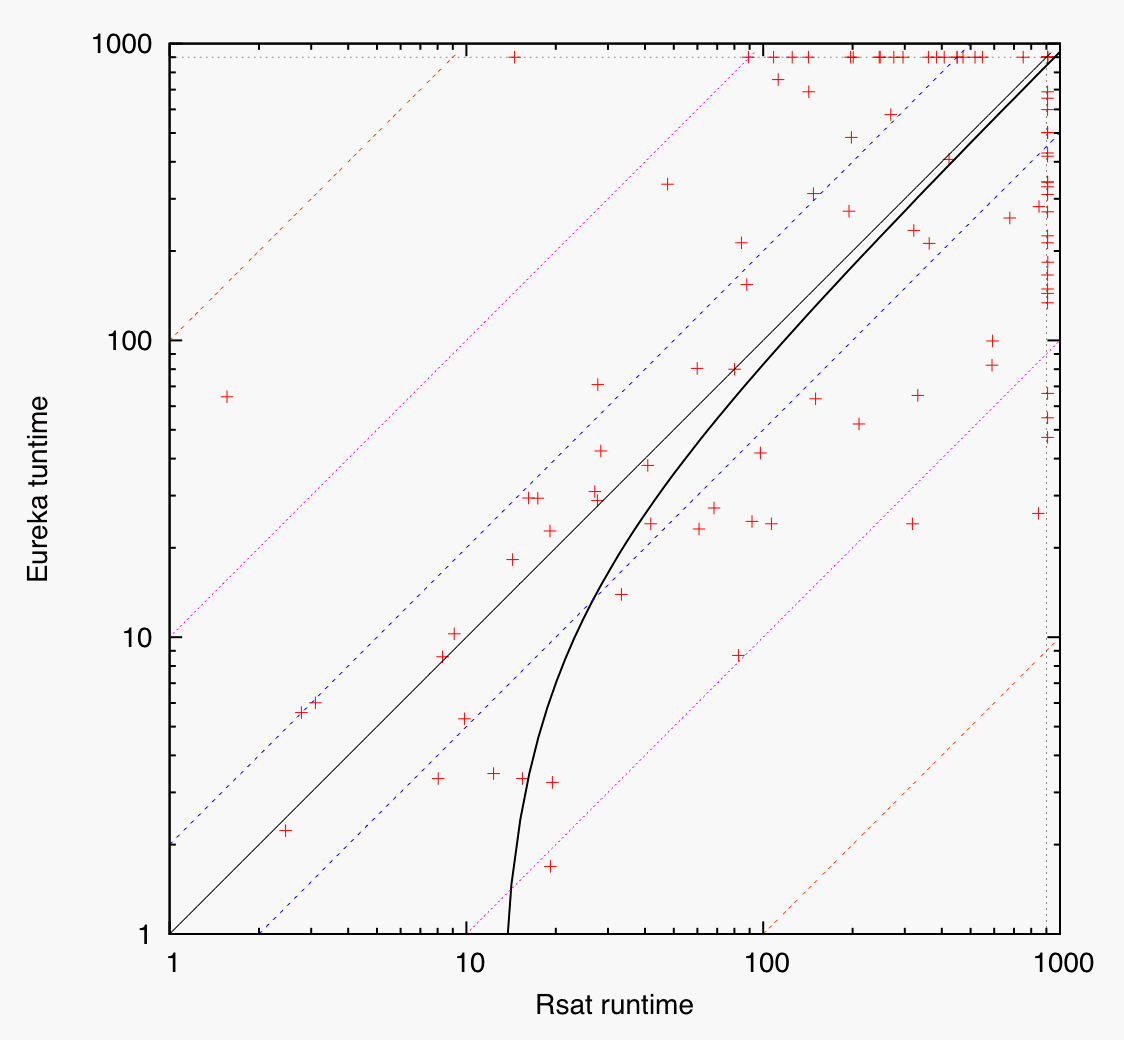
- first figure: Eureka superior on easy instances, slightly faster (0.6% according to regression line) on hard instances
- second figure: Rsat slightly better on easy instances, but minisat2.0 slightly faster on hard instances (6.5%)
- third figure: Eureka faster on easy instances, slightly faster on hard instances (5.0%)